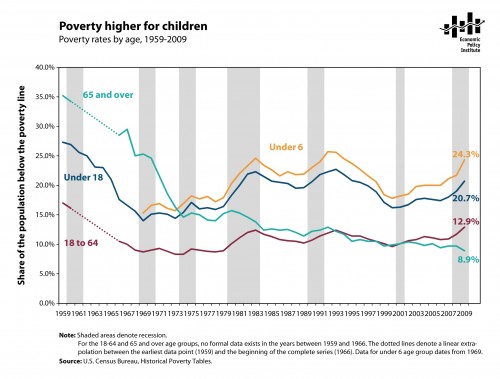
May 19, 2011 : Austin Frakt chart from The State of Working America:

You’re looking at poverty rates from 1959-2009, by different age groups.
Almost one quarter of children below the age of 6 in the United States were in poverty in 2009. That number had been increasing over the years before that. Think about it. One in four children in the richest country in the world are in poverty. The next most prevalent group was children 6-18.
Think about that as we talk about cutting Medicaid, which covers one third-of children, likely all the children you see above. Are they to blame?
One more thing. I know entitlement programs are coming under siege lately, but look at this chart and try and tell me that providing universal single-payer health care to the elderly in 1965 wasn’t an anti-poverty program as well as a health care program.
Economic Policy Institute. 2011. Poverty higher for children. The State of Working America. Washington, D.C.: Economic Policy Institute. Feb. 14, 2011.
http://theincidentaleconomist.com/wordpress/poverty-by-age/


No comments:
Post a Comment